Monitoring the CM Elasticsearch Index

Here's a couple different ways to manage your new CM 9.2 Elasticsearch instance.


via Chrome


Visit the webstore and add the ElasticSearch Head extension.

2017-12-05_22-25-23.png

Then when you launch the extension you can update the server address.  With the visuals I can easily see that the unassigned shards are what's pushing my health to yellow.  

2017-12-05_17-01-51.png

You can also browse the data in the index

2017-12-05_17-04-30.png

via Head Stand-alone Server


The same functionality as what's shown above, however the interface is a stand-alone server operating off port 9100.  You'd access it via any browser from address http://localhost:9100.  You would use this option if you can't use chrome.  


via Powershell


Install Elastico from an elevated powershell prompt.

2017-12-05_9-54-45.png

You have to trust the repository in order to continue.  If you're in a secure environment then visit the github page for the source, then manually install the module.

2017-12-05_9-55-34.png

Now I can run a command to check the overall cluster's health...

2017-12-05_10-06-05.png

Another command to check the statuses of the indexes...

2017-12-05_10-08-45.png

Note that in both instances I'm calling a script intended for v5 even though I'm using v6.  I can actually run any version of the command as they all seem to be forward & backward compatible.  Probably still makes the most sense to run the one intended for the most recent version of ES.

I can also perform a search.  I went to the client and found the record I worked with in my last post (I had used Kibana as a front-end to the ES index).  Then I searched via powershell.

2017-12-05_10-21-31.png

via Kibana


When creating your index pattern, keep in mind that the default naming convention for the CM content index starts with "hpecm_".  You could use that, or just a plain asterisk, to configure your access.  If you wish to use the Timelion feature then you should also pick the date registered field as the time filter.

2017-12-05_22-05-46.png

When you then click discover you can explore the index.

2017-12-05_22-10-35.png

You can pick a different time period that might show some results...

2017-12-05_22-11-18.png

If I can now get some data then I know the system is at least partially working.  Kibana doesn't really give much detail as to the internal workings of the cluster and/or index.

2017-12-05_22-12-40.png

Use Kibana to inspect your ElasticSearch index

Now that I've got ElasticSearch installed, configured, and "ready to go", why doesn't it work?  When I "upgraded" my machine to 9.2 I configured ElasticSearch and imported the contents of the ISO.  I then checked that it worked by searching for "content".

2017-12-04_17-59-35.png

Then I imported the JFK archives and tried searching for the word kennedy.  No results this time. :(

This can't be right!

This can't be right!

I checked the event processor and see it was blocked by error...

2017-12-04_14-39-40.png

I was actively importing records via a powershell script and didn't want to restart the entire workgroup service.  Instead, I killed TRIMEvent.exe and watched it spawn again automatically.  Then the event processor just flew through all of my records.

2017-12-04_14-43-11.png

After I let them finish processing, I try running a search for kennedy and get some results.  You can see the results below.  

2017-12-04_17-27-14.png

What I am most excited about though is ElasticSearch.  If I installed kibana I can visualize the electronic content of my records.  For instance, I'll search for the record number highlighted above and show the results below.

The record is returned because the word was in the contents

The record is returned because the word was in the contents

But that's not all!  Content Manager is pushing lots of data into the index, as shown below.

2017-12-04_17-44-05.png

I can now use open source tools to convert my records repository into a big data gold mine.  I can use the visualize feature to generate some reports.  There's even an ElasticSearch connector for MicroStrategy.  At a minimum, if something appears wrong with Content Index I can use Kibana as a way to verify what should be returned for a given record.

Goodbye IDOL, Hello Elasticsearch

Yay!  As of 9.2, IDOL is no longer the default content index engine.  This is cool on many levels.  In its' place the developers have introduced Elasticsearch.  Time to dive in....

First I installed the Java Runtime Environment on the server...

2017-12-01_23-46-59.png
2017-12-01_23-47-16.png
2017-12-01_23-48-47.png

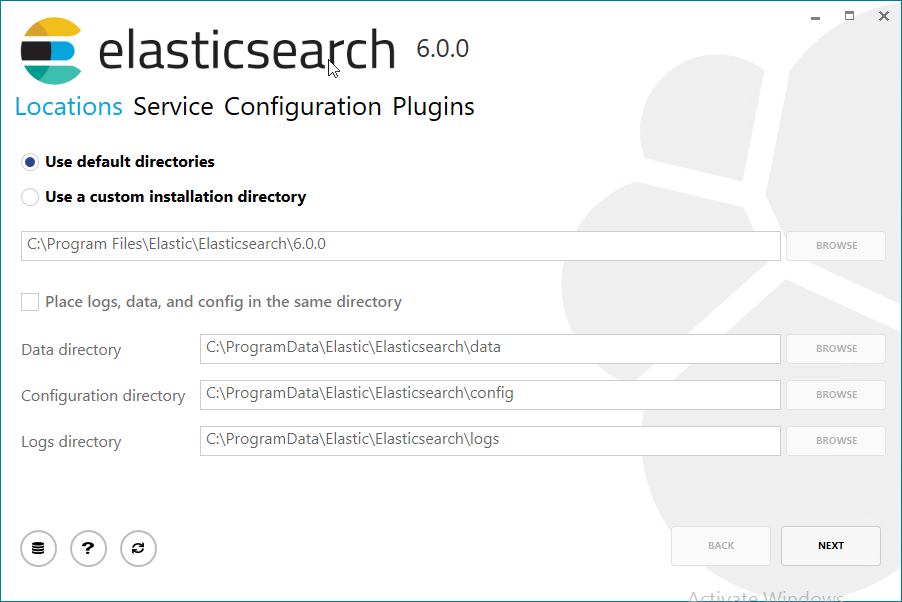
Then I installed ElasticSearch....

 
2017-12-01_23-51-19.png
 
 
2017-12-01_23-51-45.png


To test that it's working I use powershell as described in the documentation...

2017-12-02_0-03-39.png

Now over in the Enterprise Studio I can create a new content index.  Since it defaults to the current machine I should not need to change any settings.

2017-12-02_0-10-37.png

Next I need to enable the content indexing event....

2017-12-02_0-13-00.png

I dropped in all of the documentation from the source ISO and watched it process them almost immediately..

2017-12-02_0-17-17.png

I went back to the client and searched for a keyword and did receive results.  

2017-12-02_0-19-00.png

ElasticSearch is very cool!  Hopefully I'll get some time to post more about it.  I'm happy IDOL is gone in 9.2.