Migrating the SQL DemoDB to PostgresSQL

The installation media for Content Manager 9.2 comes with a demonstration dataset that can be used for testing and training.  Although I think the data within it is junk, it's been with the product for so long that I can't help but to continue using it.  To mount the dataset you have to restore a backup file onto a SQL Server and then register it within the Enterprise Studio.

SQL Server is a bit too expensive for my testing purposes, so I need to get this dataset into PostgresSQL.  In this post I'll show how I accomplished this.  The same approach could be taken for any migration between SQL and PostgresSQL.

I'm starting this post having already restored the DemoDB onto a SQL Server:

 
2018-04-21_15-15-20.png
 

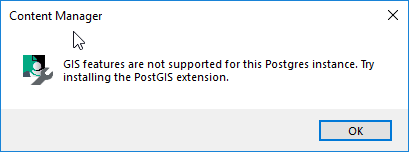
If you look at the connection details for the highlighted dataset, you'll see that GIS is enabled for this dataset.  My target environment will not support GIS.  This inhibits my ability to use the migrate feature when creating my new dataset.  If I tried to migrate it directly to my target environment I would receive the error message shown below.

2018-04-21_14-12-21.png

Even if I try to migrate from SQL to SQL, I can't migrate unless GIS is retained...

2018-04-21_14-12-10.png

To use the migration feature I need to first have a dataset that does not support GIS.  I'll use the export feature of the GIS enabled dataset to give me something I can work with.  Then I'll import that into a blank dataset without GIS enabled.

 
2018-04-21_9-58-55.png
 

The first export will be to SQL Server, but without GIS enabled.  When prompted I just need to provide a location for the exported script & data.

 
2018-04-21_15-27-47.png
 

Once completed I then created a new dataset.  This dataset was not initialized with any data, nor was GIS enabled. The screenshot below details the important dataset properties to be configured during creation.

 
2018-04-21_15-31-01.png
 

After it was created I can see both datasets within the Enterprise Studio, as shown below.

 
2018-04-21_14-44-53.png
 

Next I switched over to SQL Server Management Studio and opened the script generated as part of the export of the DemoDB.  I then executed the script within the database used for the newly created DemoDB No GIS.  This populates the empty dataset with all of the data from the original DemoDB.  I will lose all of the GIS data, but that's ok with me. 


Now I can create a new dataset on my workgroup server.  During it's creation I must specify a bulk loading path.  It's used in the same manner as the export process used in the first few steps.  The migration actually first performs an export and then imports those files, just like I did in SQL Server.  


On the last step of the creation wizard I can select my DemoDB No GIS dataset, as shown below.

 
2018-04-21_14-47-13.png
 

Now the Enterprise Studio shows me all three datasets.

 
2018-04-21_15-09-44.png
 

Monitoring CM with ELK

In this post I'll show how to use the ELK components to make an effective, free way to monitor any size Content Manager implementation.  At the end of this post we'll end up with a rudamentary dashboard like shown below.  This dashboard highlights errors as reported in the windows logs (which includes CM).

Kibana dashboard using winlogbeats and filebeats as a source

Kibana dashboard using winlogbeats and filebeats as a source

To make all this magic work I'll need to place beats in various locations.  On all of my servers I'll place both a filelogbeat and a winlogbeat.  I'll use winlogbeats to monitor windows instrumention, which will include content manager entries in system logs.  I'll also use filelogbeats to monitor the content manager specific log files and the audit logs.

To start I create one server with both installed and configured.  I'll zip this entire structure and copy it to each server in my environment.  Then I'll register the two beats without modifying the configuration.

2017-12-13_21-25-55.png

For now I'm going to focus on the winlogbeats.  I modified the configuration file so that it includes a tag I can use as a filter in saved searches, as well as information about my kibana and elasticsearch hosts.

You'd use proper server host addresses

You'd use proper server host addresses

With this saved on 3 of my servers I switch over to kibana.  Here I'll start configuring my dashboards.  The dashboards will be composed of several visuals.  Those visuals will be populated with content from elasticsearch, based on the query provided.  So to start I create several saved searches.

Here's a saved search to give me just errors from any of the servers.  I'll name it "Windows Log Error".

2017-12-13_21-47-34.png

Here's a saved search I'll name "CM Windows Log Errors".  These will come from winlogbeats on all CM servers I've installed the winlogbeats agent (but not several others which are outside of CM).

2017-12-13_21-43-25.png

Next I'll create one visual that tells me how many errors I've got overall (the first saved search).

2017-12-14_9-37-03.png

I then pick my saved search...

2017-12-13_21-57-44.png

Then configure it to split out by computer name.

2017-12-13_21-58-35.png

Then I click save and name it error counts.  Next I create a data table for the error sources, as shown below.

2017-12-13_22-01-44.png

Then a pie chart based on all of the audit events....

2017-12-13_22-02-32.png

Next I created a new dashboard and placed the three visuals onto it.  Then I added one saved search, the CM specific windows error logs.  This is the same as a data table, but thought I'd show it.

2017-12-13_22-04-12.png

Last step is to save the dashboard.  By checking the box the user can change the dashboard content by tweaking the timeline (visible on almost all pages of kibana).

2017-12-13_21-42-01.png

Now I can access this dashboard from a list of them.  Keep in mind that you can tag your development servers differently from production, so that might be a different dashboard.  You can also share them.

2017-12-13_22-05-17.png

That gives me this final dashboard shown below.  Note in the image the top-right corner where I've changed the time frame to the previous 1 year.  Then note how I added a filter to exclude one server in particular.  It's amazing what can be built.

2017-12-13_22-12-38.png

Automating movement to cheaper storage

Now that I have an Azure Blob store configured, I want to have documents moved there after they haven't been used for a while.  I've previously shown how to do this manually within the client, but now I'll show how to automate it.

The script is very straight-forward and follows these steps:

  1. Find the target store in CM
  2. Find all documents to be moved
  3. Move each document to the target store

Here's an implementation of this within powershell:

Clear-Host
Add-Type -Path "D:\Program Files\Hewlett Packard Enterprise\Content Manager\HP.HPTRIM.SDK.dll"
$LocalStoreName = "Main Document Store"
$AzureStoreName = "Azure Storage"
$SearchString = "store:$($LocalStoreName) and accessedOn<Previous Year"
$Database = New-Object HP.HPTRIM.SDK.Database
$Database.Connect()
#fetch the store and exit if missing
$Tier3Store = $Database.FindTrimObjectByName([HP.HPTRIM.SDK.BaseObjectTypes]::ElectronicStore, $AzureStoreName)
if ( $Tier3Store -eq $null ) {
    Write-Error "Unable to find store named '$($AzureStoreName)'"
    exit
}
#search for records eligible for transfer
$Records = New-Object HP.HPTRIM.SDK.TrimMainObjectSearch -ArgumentList $Database, Record
$Records.SearchString = $SearchString
Write-Host "Found $($Records.Count) records"
$x = 0
#transfer each record
foreach ( $Result in $Records ) 
{
    $Record = [HP.HPTRIM.SDK.Record]$Result
    $record.TransferStorage($Tier3Store, $true)
    Write-Host "Record $($Record.Number) transfered"
	$x++
}

I ran it to get the results below.  I forced it to stop after the first record for demonstration purposes, but you should get the idea. 

2017-12-07_21-11-57.png