Stress Testing GCP CM via ServiceAPI and jmeter
Let's see how my GCP hosted CM infrastructure holds up under ridiculous load.
jmeter can be downloaded here. Since this is a pure Java application you'll need to have java installed (I'm using JRE 9 but most should use JDK 8 here). Note that JDK v10 is not yet officially supported.
After extracting jmeter you launch it by executing jmeter.bat...
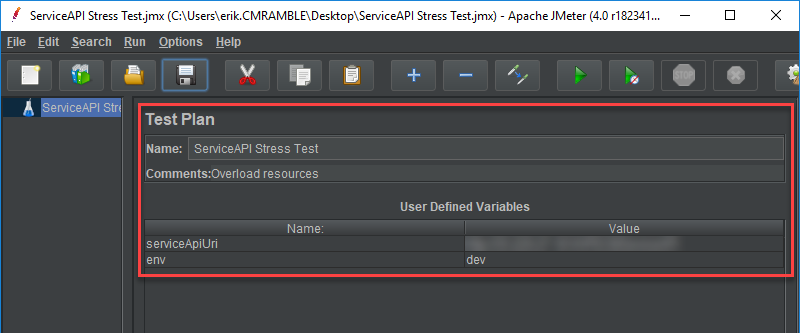
Every test plan should have a name, description, and a few core variables...
There are many, many possible ways to build out a test plan. Each will have at least one thread group though, so I'll start by creating just one.
As shown below, I created a thread group devoted to creating folders. I also set error action to stop test. Later I'll come back and increase the thread properties, but for now I only want one thread so that I can finish the configuration.
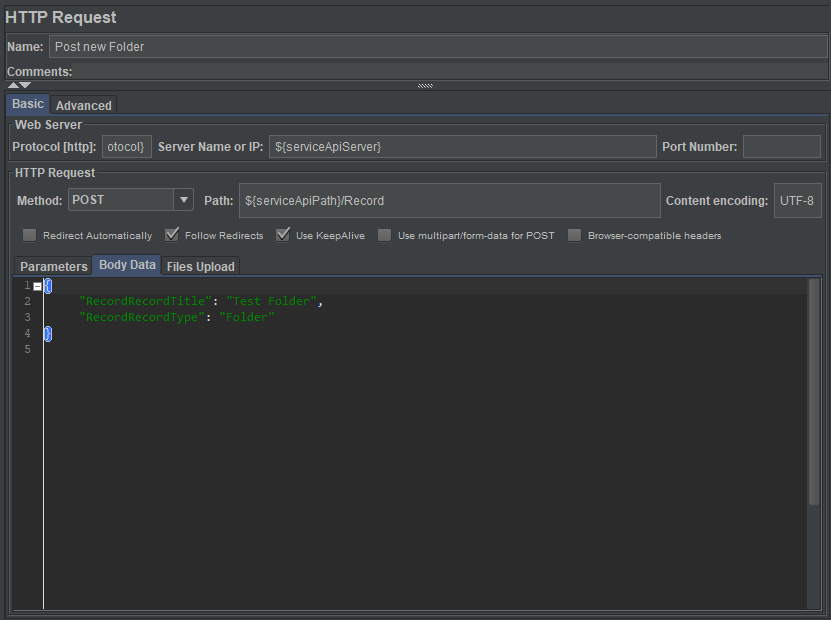
Next I'll add an HTTP Request Sampler, as shown below...
The sampler is configured to submit a Json record definition, with values for Title and Record Type. This is posted to the ServiceAPI end-point for records. It's as basic as you can get!
I'll also need an HTTP Header Manager though, so that the ServiceAPI understands I'm intending to work with json data.
Last, I'll add a View Results Tree Listener, like so...
Now I can run the test plan and review the results...
After fixing the issue with my json (I used "RecordRecordTitle" instead of "RecordTypedTitle"), I can run it again to see success.
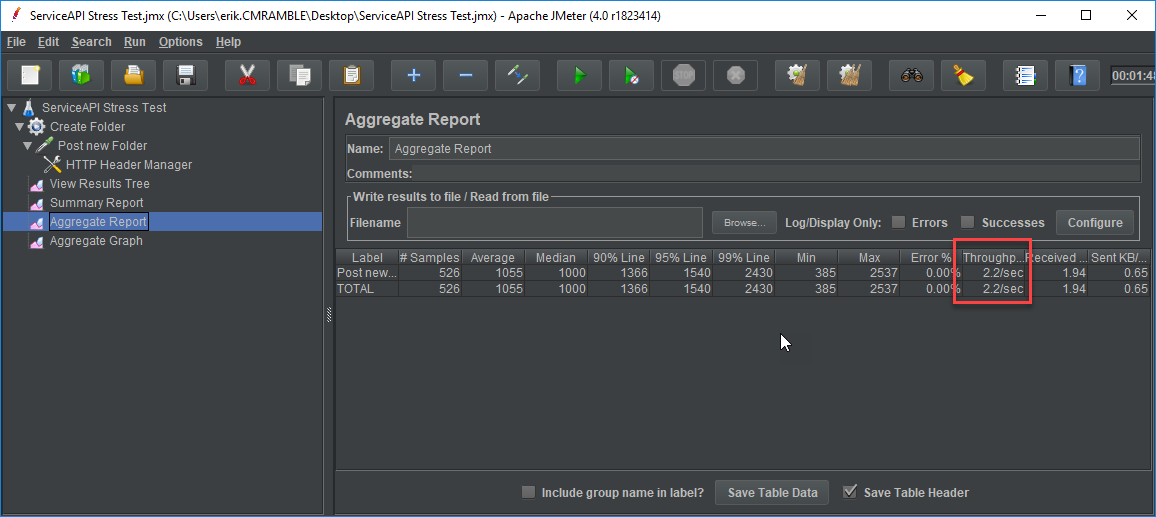
Now I'll disable the view results tree, add a few report listeners, and ramp up the number of threads to 5. Each thread will submit 5 new folders. With that I can see the average throughput.
Next I'll increase the number of folders, tweak the ramp-up period, and delay thread creation until needed. Then I run it and can review a the larger sample set.
This is anecdotal though. I need to also monitor all of the resources within the stack. For instance, as shown below, I can see the impact of that minor load on the CPU of the workgroup server. I'd want to also monitor the workgroup server(s) RAM, disk IO, network IO, and event logs. Same goes for the database server and any components of the stack.
From here the stress test plan could include logic to also create documents within the folders, run complex searches, or perform actions. There are many other considerations before running the test plan, such as: running the plan via command line instead of GUI, scheduling the plan across multiple workstations, calculating appropriate thread count/ramp-up period based on infrastructure, and chaining multiple HTTP requests to more aptly reflect end-user actions.
For fun though I'm going to create 25,000 folders and see what happens!


