Monitoring CM Cloud Instance Resources with Stackdriver
It's saving me a tremendous amount of time having Content Manager in my secure private cloud! I'd like to monitor the environment though; and for that I'll use Stackdriver. The free tier gives me everything I need for my current usage. As I ramp up my implementation though I'll need to expand its' usage, so understanding the pricing model is a must.
First things first.... I need to install it on my VM by using this command:
invoke-webrequest "https://dl.google.com/cloudagents/windows/StackdriverLogging-v1-8.exe" -OutFile "StackdriverLogging-v1-8.exe";
.\"StackdriverLogging-v1-8.exe"
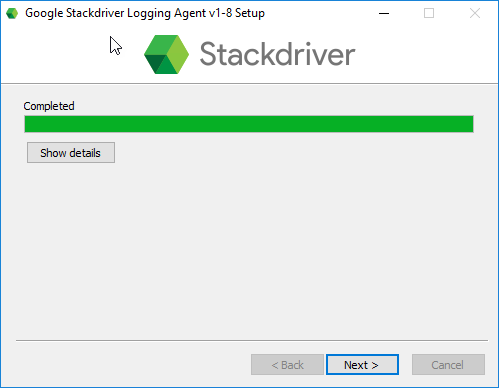
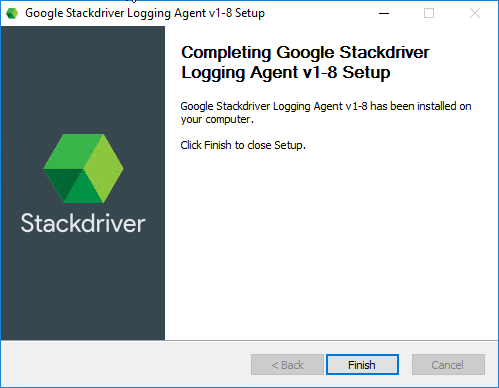
Then ran through the installer as with any other application:
Next I flip over to my Stackdriver homepage and BAM.... everything's already done for me:
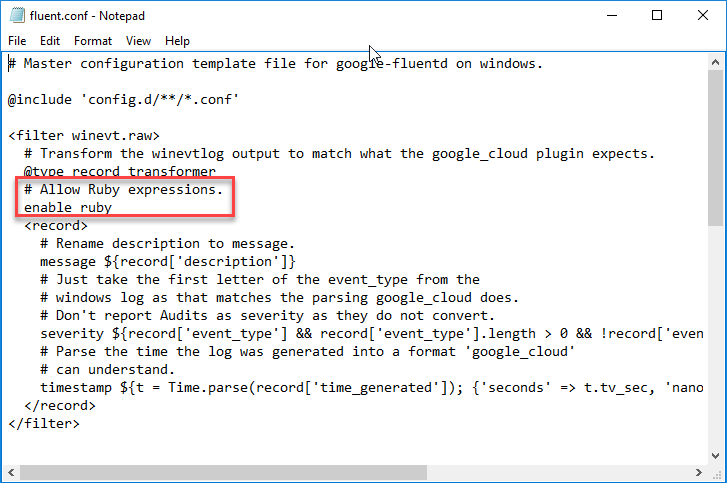
Now a natural question would be "what about content manager logs and events?". This can be easily done! The logging agent support ruby expressions, as shown below.
I can re-use the custom grok filters I created within Elasticsearch to parse CM logging sources! A topic for another day! For now I'll create an alerting policy to keep me in-the-know.
What I find most useful here is that you can see information about the conditions you're trying to set. So helpful to be able to see some historical data for the metric I'm configuring an alert on.
The rest is pretty self-explanatory! :)


