Fiscal Calendar Fun

A collection of SQL statements to be used as logical tables in support of fiscal calendar transformations with dates stored as integers.  Will need these to be able to report metrics out of CM based on an internal fiscal calendar.  


Current Fiscal Day, Month, and Year with Start/End & Yesterday

SELECT 
	fiscal_month_year_nr, 
	fiscal_year_nr, 
	fiscal_month_nr, 
	fiscal_month_year_bgn, 
	fiscal_month_year_end, 
	fiscal_year_bgn, 
	fiscal_year_end, 
	cast(convert(varchar(8),dateadd(d,-1,getdate()),112) as int) yesterday 
FROM Dim_Fiscal_Month_Year 
WHERE 
	fiscal_month_year_bgn <= cast(convert(varchar(8),dateadd(d,-1,getdate()),112) as int) 
	AND 
	fiscal_month_year_end >= cast(convert(varchar(8),dateadd(d,-1,getdate()),112) as int)

Fiscal Week to Date

select d.[date_id], wtd.[Date_id] wtd_fiscal_date_id
from [Dim_Date] dd
join [Dim_Fiscal_week_Year] fwy
	on (dd.[Fiscal_week_year_nr] = fwy.[fiscal_week_year_nr])
join [Dim_Date] wtd
	on (wtd.Date_id between fwy.[fiscal_week_year_bgn] and dd.[date_id])

Fiscal Month to Date

select dd.[date_id], mtd.[Date_id] mtd_date_id
from [Dim_Date] dd
join [Dim_Fiscal_Month_Year] fmy
	on (dd.[Fiscal_month_year_nr] = fmy.[fiscal_month_year_nr])
join [Dim_Date] mtd
	on (mtd.Date_id between fmy.[fiscal_month_year_bgn] and dd.[date_id])

Fiscal Quarter to Date

select dd.[date_id], qtd.[Date_id] qtd_date_id
from [Dim_Date] dd
join [Dim_Fiscal_Quarter_Year] fqy
    on (dd.[Fiscal_quarter_year_nr] = fqy.[fiscal_quarter_year_nr])
join [Dim_Date] qtd
	on (qtd.Date_id between fqy.[fiscal_quarter_year_bgn] and dd.[date_id])

Fiscal Year to Date

select dd.[date_id], ytd.[Date_id] ytd_date_id
from [Dim_Date] dd
join [Dim_Fiscal_Year] fy
	on (dd.[Fiscal_year_nr] = fy.[fiscal_year_nr])
join [Dim_Date] ytd
	on (ytd.Date_id between fy.[fiscal_year_bgn] and dd.[date_id])

Prior Fiscal Year Day

The trick here is to calculate the number of days since the start of the year (for the given date) and then add that number to the start date of the prior fiscal year.

select d.[Date_id], pyd.Date_id pydate_id 
from [Dim_Date] d 
join [Dim_Fiscal_Year] fy 
	on d.Fiscal_year_nr = fy.fiscal_year_nr 
join [Dim_Fiscal_Year] py 
	on (py.fiscal_year_ix = (fy.fiscal_year_ix-1)) 
join [Dim_Date] pyd 
	on (pyd.Calendar_dt = DATEADD(D,Datediff(D,convert(date,CONVERT(varchar(10),fy.fiscal_year_bgn,101)), d.Calendar_dt),convert(date,CONVERT(varchar(10),py.fiscal_year_bgn,101))))
where fy.fiscal_year_bgn not in (-1,0)
Pointing Microstrategy at the Ontario Energy Board

If you read yesterday's post then you know it's possible to point Microstrategy at Content Manager via the ServiceAPI.  It's an easy win for an initial effort.  I was using data from the ridiculously unusable demonstration database.  What's the point in shipping a demonstration database that lacks any real data?

I turned my sites northward, to the frozen land we colloquially call our "attic" (see: Canada).  There I found the Ontario Energy Board (OEB), which makes available lots of data via the ServiceAPI.  So I pointed Microstrategy there to see what can be accomplished.

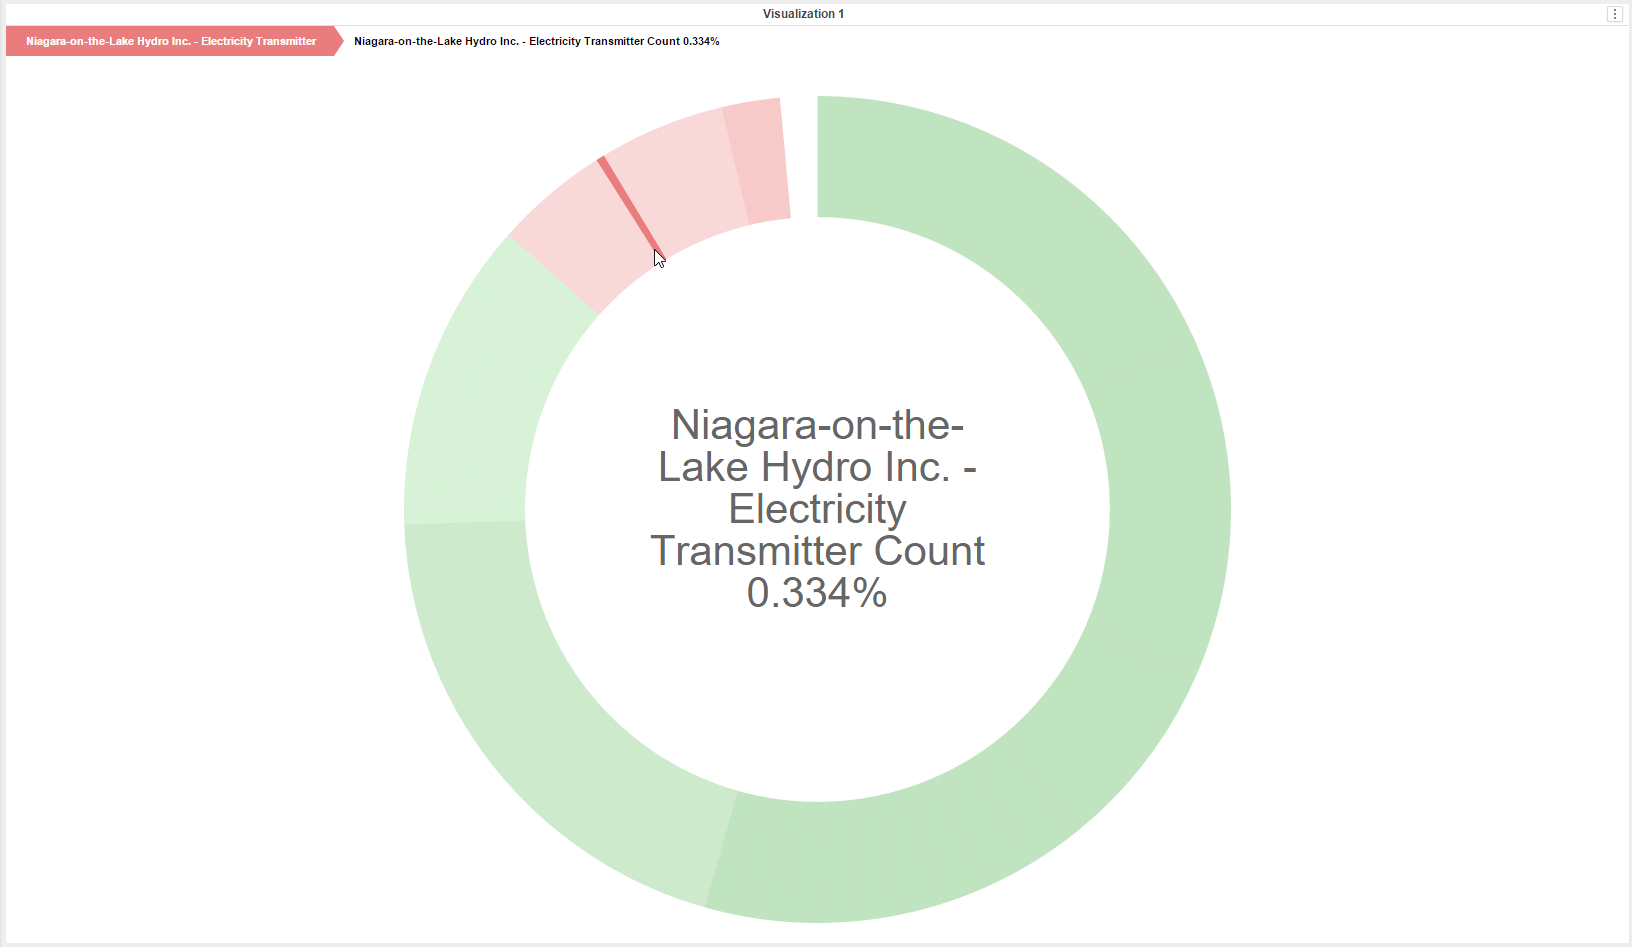
Here's a sequences sunburst, which quickly breaks-out applicants by volume of submissions...

2018-02-21_12-48-17.png
2018-02-21_12-49-34.png

Then I created a data grid with a selector for the applicant, which provides a quick view of submitted documents.  Changing the applicant changes the contents of the grid...

Then I moved onto trying to create a visualization based on the record dates.  Three dates are exposed: Date Issued, Date Received, and Date Modified.  I'd like to show a timeline for each applicant and the types of documents they are submitting.  I decide to leverage date received & date issued in the google timeline visualization shown below.

2018-02-21_13-11-23.png

Yay!  Some fun visuals!


Connecting Microstategy to CM

In this post I'll show how to use the free Microstrategy Desktop application to expose record destruction information.  As shown below, we'll start this process by launching the application and creating a new Dossier...

2018-02-20_9-34-57.png

Next I want to add some data from Content Manager into this dossier...

2018-02-20_9-36-14.png

Here I'm going to select "Data from URL", so that I can ensure security is respected.  If I were to use Databases, and connect directly to the backend RDBMS, I would be directly accessing record data without any security validation.  Instead, I'll point to the ServiceAPI (which will be configured to honor security).

2018-02-20_9-37-06.png

Now I'll enter the URL to the ServiceAPI record end-point.  For authentication, I'll use Windows (though you may need to configure this in a different manner).  Then I click Finish to complete this step.

2018-02-20_9-52-58.png

Now all of my properties from CM are listed in the datasets pane.... 

2018-02-20_9-45-33.png

Next I'll switch my visualization to a pie chart...

2018-02-20_9-55-03.png

Then I'll add owner as a data element...

2018-02-20_9-56-00.png

Next I'll filter out records which cannot yet be destroyed...

2018-02-20_9-57-40.png

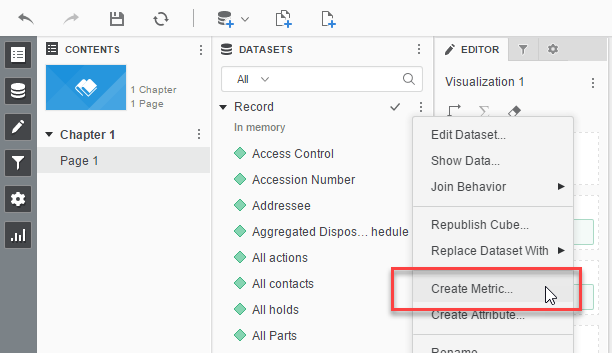
Now I'll create a metric, so that the pie slices are proportional...

2018-02-20_10-06-46.png

I'll configure the metric to be the number of unique ID's for a given owner in the visualization...

2018-02-20_10-08-08.png

Lastly, I'll drag the ownership count into the angle property of the visualization...

2018-02-20_10-10-27.png

Voila!  This is a rather simple example, but it should demonstrate the capabilities.  If you take the same approach shown in my aggregating retention data series, then you can see how to expose ServiceAPI end-points so that your Microstrategy users do not have to construct query parameters.