Pointing Microstrategy at the Ontario Energy Board
If you read yesterday's post then you know it's possible to point Microstrategy at Content Manager via the ServiceAPI. It's an easy win for an initial effort. I was using data from the ridiculously unusable demonstration database. What's the point in shipping a demonstration database that lacks any real data?
I turned my sites northward, to the frozen land we colloquially call our "attic" (see: Canada). There I found the Ontario Energy Board (OEB), which makes available lots of data via the ServiceAPI. So I pointed Microstrategy there to see what can be accomplished.
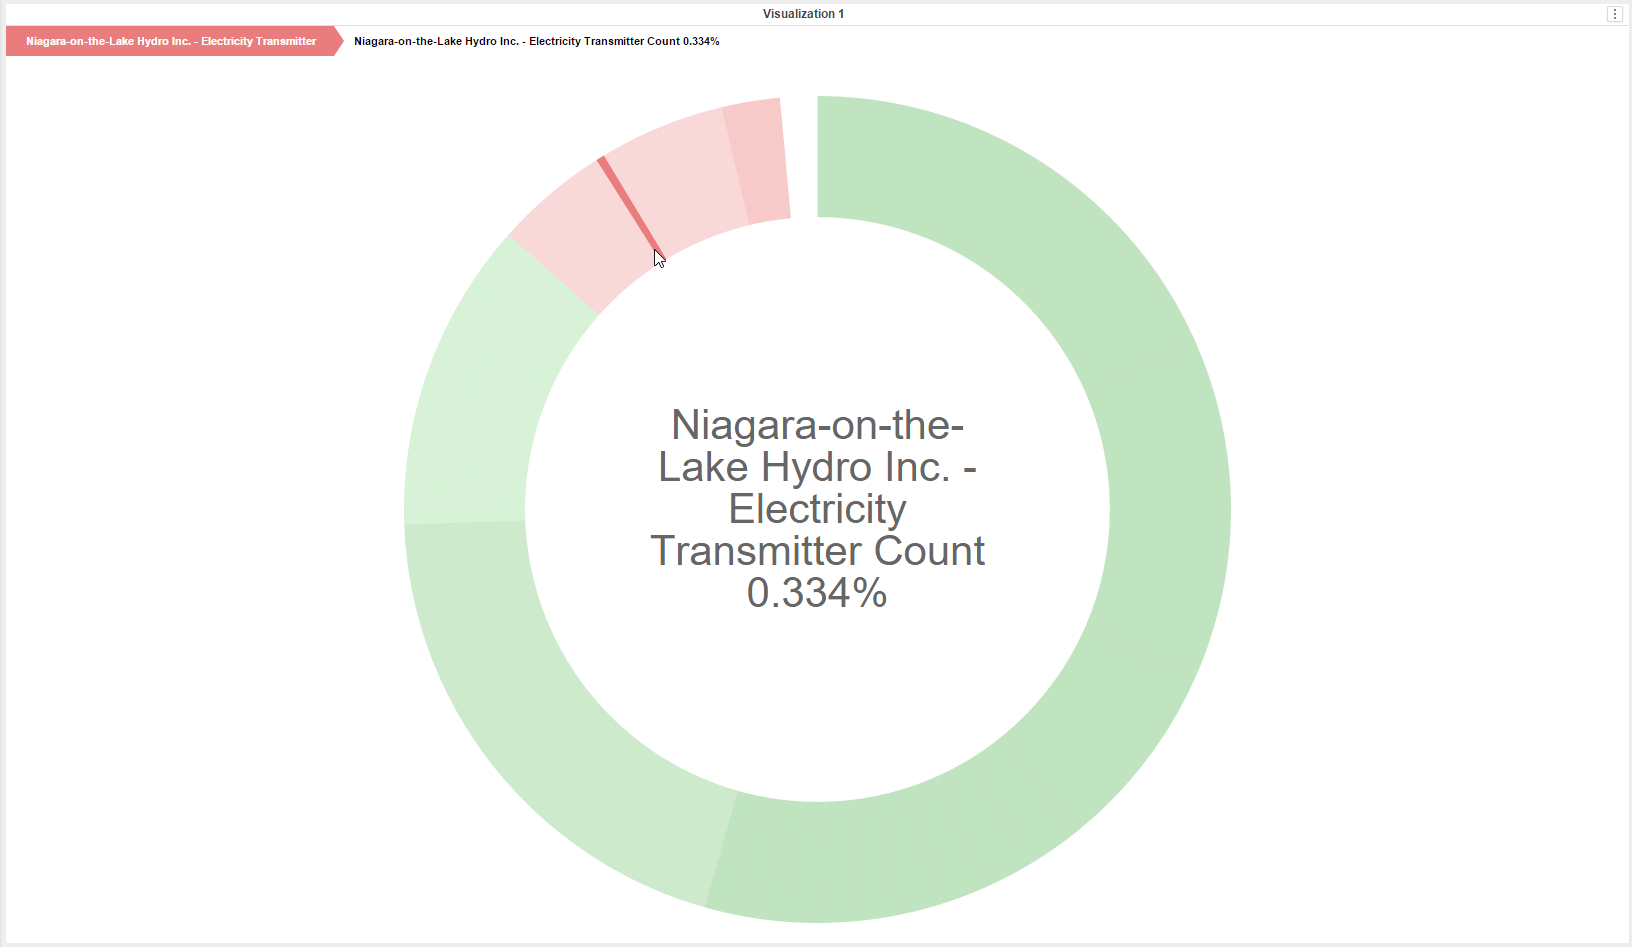
Here's a sequences sunburst, which quickly breaks-out applicants by volume of submissions...
Then I created a data grid with a selector for the applicant, which provides a quick view of submitted documents. Changing the applicant changes the contents of the grid...
Then I moved onto trying to create a visualization based on the record dates. Three dates are exposed: Date Issued, Date Received, and Date Modified. I'd like to show a timeline for each applicant and the types of documents they are submitting. I decide to leverage date received & date issued in the google timeline visualization shown below.
Yay! Some fun visuals!


